Distributed Monitoring
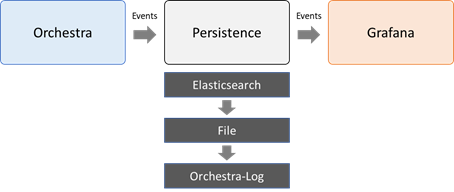
Orchestra supports distributed monitoring of Orchestra events using third-party tools like Grafana. To facilitate this monitoring, the Orchestra runtime writes system events and process model events (referred to as process events) to persistent storage.
Currently, Elasticsearch is the primary choice for this purpose. In the event of issues while writing the events, fallback writers are employed to ensure that events are stored nonetheless. The standard fallback chain is as follows: Writing to: Elasticsearch → File → Orchestra-Log
Configure Elasticsearch (version 7.11.x)
The Elastic Stack is the preferred option for persisting system and process events for distributed monitoring.
Index Mapping
By default, without defining an index mapping, Elasticsearch automatically detects the data type of all fields based on their values. However, for effective monitoring in Grafana, the timestamp must be field type “Date”. The following steps ensure that this requirement is met through an index mapping based on an index template.
-
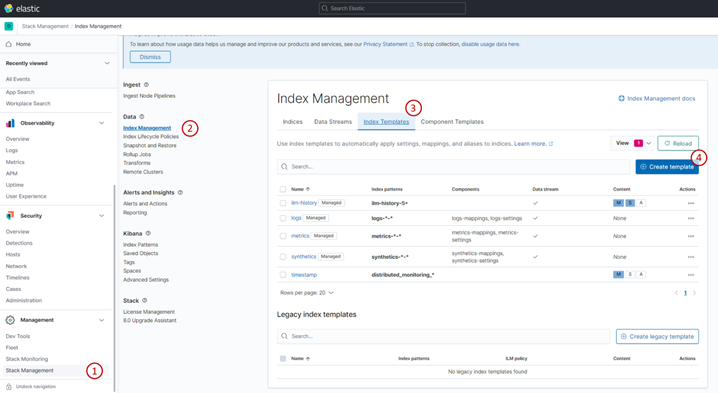
Open Kibana. Under “Management,” navigate to “Stack Management.”
-
Under “Data,” select “Index Management.”
-
Navigate to the tab “Index Templates.”
-
Create a new template by clicking “Create template.”
-
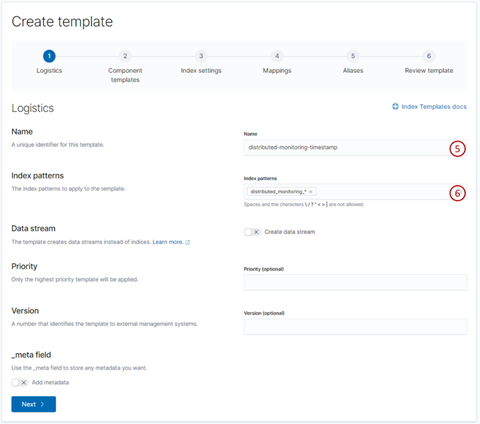
Enter a name for the index template.
-
Input the following pattern to apply the template to the corresponding indices: “distributed_monitoring_*.”
Attention: If your Orchestra Runtime Configuration defines different index names, modify this pattern accordingly.
-
Go to “Mappings.”
-
Add “@timestamp” as the field name and “Date” as the field type.
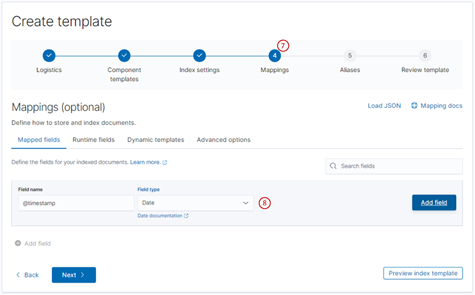
-
Go to “Review template.”
-
Confirm the new template by clicking “Create template.”
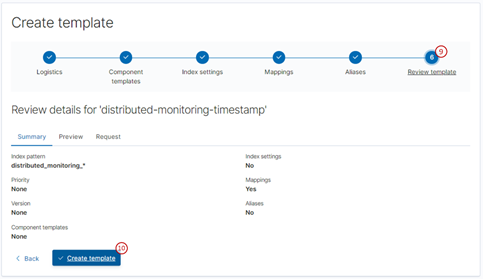
With this template, the correct formatting for @timestamp fields will be applied to all newly created indices matching the defined pattern.
Configure Orchestra
For distributed monitoring, Orchestra supports writing system and process events to persistent storage. The following configurations must be customized according to your setup.
General
- Enable event processing.
Elasticsearch
-
Configure routing (via Elastic Cloud-ID or hostname and port).
-
Configure authentication (via API Key or username and password).
-
Set writing options (bulk size, etc.).
File
- Configure writing options (file paths).
Orchestra-Log
- Set writing options (Log Level).
To update these settings, navigate to the Distributed Monitoring settings as follows.
-
Open the Orchestra Monitor and go to “Settings.”
-
Navigate to “Environment Settings.”
-
Select “Distributed Monitoring” in the group selection.
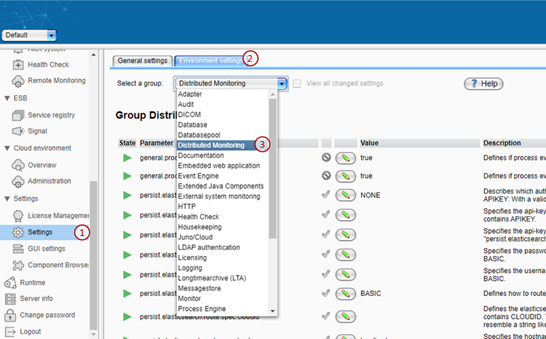
All further configurations are detailed in the subsequent chapters and correspond to this environment group.
General
These settings determine whether system and/or process events should be written to persistent storage. The following options are available:
-
general.process.processevents.enabled: Defines whether process events should be persisted. -
general.process.systemevents.enabled: Defines whether system events should be persisted.
Elasticsearch Routing
These settings specify how to route to Elasticsearch. Update the value of persist.elasticsearch.route.decl.method to one of the following options:
-
Value “BASIC”: Route via hostname and port. Attention:
-
persist.elasticsearch.route.spec.hostname: Define the hostname. -
persist.elasticsearch.route.spec.port: Define the port.
-
-
Value “CLOUDID”: Route via Elastic Cloud-ID. Attention:
persist.elasticsearch.route.spec.cloudid: Define the Cloud-ID.
Elasticsearch Authentication Method
These settings determine how to authenticate to Elasticsearch. Update the value of persist.elasticsearch.auth.decl.method to one of the following options:
-
Value “NONE”: No authentication.
-
Value “BASIC”: Authenticate via username and password. Attention:
-
persist.elasticsearch.auth.spec.username: Define the username. -
persist.elasticsearch.auth.spec.password: Define the password.
-
-
Value “APIKEY”: Authenticate via API Key. Attention:
-
persist.elasticsearch.auth.spec.apikey.id: Define the API Key ID. -
persist.elasticsearch.auth.spec.apikey.secret: Define the API Key secret.
-
Elasticsearch Writing Options
These settings define how to write to Elasticsearch. The following options can be customized:
-
persist.elasticsearch.write.spec.bulk.actions: Define the maximum number of items per bulk. -
persist.elasticsearch.write.spec.bulk.flush.interval.sec: Define the maximum number of seconds to wait per bulk. -
persist.elasticsearch.write.spec.bulk.size.mb: Define the maximum size of items per bulk. -
persist.elasticsearch.write.spec.concurrent.requests: Define the maximum number of concurrent requests sent to Elasticsearch. -
persist.elasticsearch.write.spec.processevents.index.name: Define the index name for process events. Attention: The corresponding Index Template for the correct @timestamp mapping must match this index name. -
persist.elasticsearch.write.spec.systemevents.index.name: Define the index name for system events. Attention: The corresponding Index Template for the correct @timestamp mapping must match this index name.
File Writer Writing Options
These settings define how to write to the file. The following options can be customized:
-
persist.filewriter.write.processevents.path: Define the path for writing process events. If the path is unavailable, a temporary, permanent file will be used instead. -
persist.filewriter.write.systemevents.path: Define the path for writing system events. If the path is unavailable, a temporary, permanent file will be used instead.
Orchestra Log Writing Options
These settings dictate how elements are logged to the Orchestra log. The log level is specified using the following option: persist.logger.write.level.
Configure Grafana
For distributed monitoring, Grafana is a viable option for monitoring system and process events. The Orchestra distributed monitoring feature includes prebuilt dashboards that display information about Orchestra nodes and their events.
However, some basic setup is necessary, including the configuration of the data source and dashboard import.
Data Source for Process Events from Elasticsearch
To monitor process events, add Elasticsearch as a data source in Grafana.
-
Open Grafana, hover over “Configuration” (gear icon) on the left, and select “Data Sources.”
-
Click the “Add data source” button.
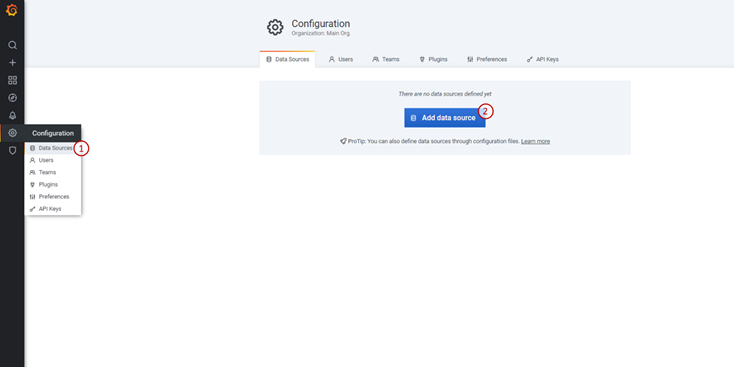
-
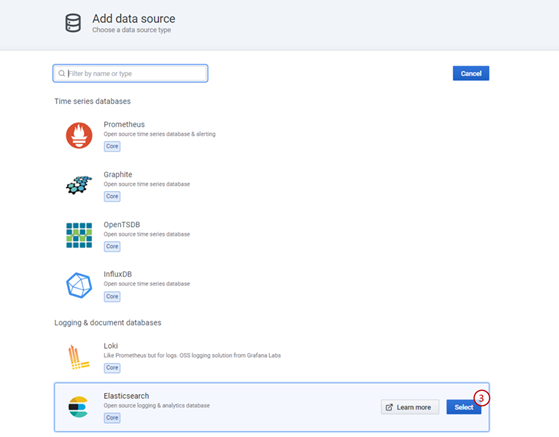
Select Elasticsearch.
-
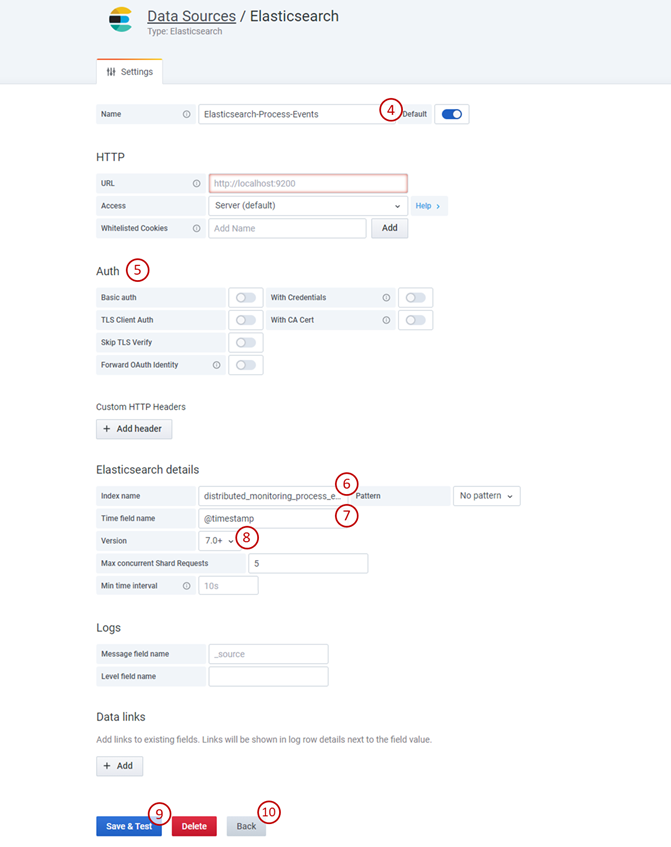
Rename the data source to “Elasticsearch-Process-Events.”
-
Set up the authentication to your Elasticsearch instance.
-
Enter “distributed_monitoring_process_events” as the index name.
-
Ensure that “@timestamp” is designated as the time field.
-
Set the version to 7.0+.
-
Click “Save & Test” to save and test your changes.
-
Click “Back” to add a second data source.
Data Source for System Events from Elasticsearch
To monitor system events, add Elasticsearch as a second data source. Start by repeating steps 1 through 3 of "Data Source for Process Events from Elasticsearch." Then continue by configuring the data source with different values.
-
Rename the data source to “Elasticsearch-System-Events.”
-
Set up the authentication to your Elasticsearch instance.
-
Enter “distributed_monitoring_system_events” as the index name.
-
Ensure that “@timestamp” is designated as the time field.
-
Set the version to 7.0+.
-
Click “Save & Test” to save and test your changes.
Import Dashboards for Process Events
To monitor process events, import the corresponding dashboard.
-
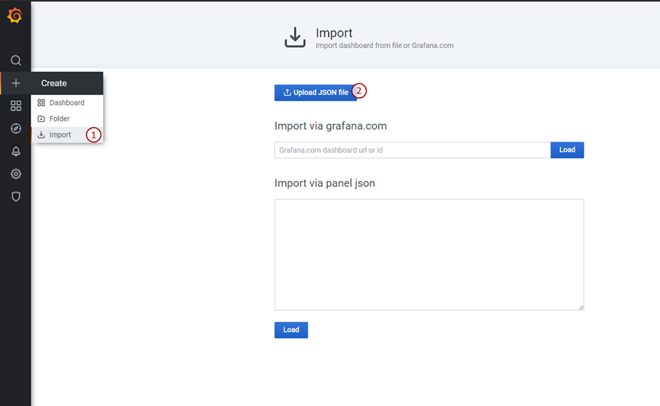
Open Grafana, hover over “Create” (plus icon) on the left, and select “Import.”
-
Click “Upload JSON file” and select the dashboard file for process events, typically named “ProcessEvents.model.json.” The base template, delivered with Orchestra, can be found here (ProcessEvents.model.json).
-
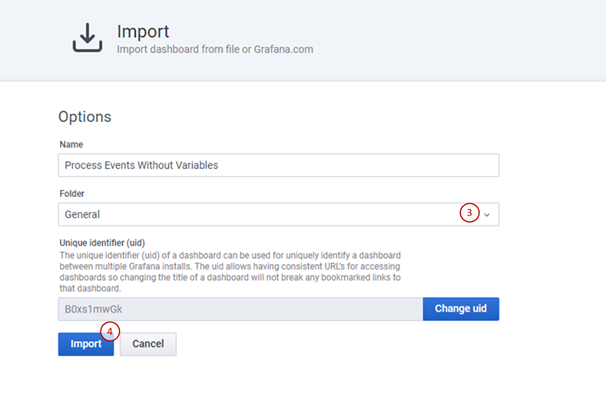
Optionally, change the folder to specify the location to store the dashboard.
-
Click “Import” to complete the import of the dashboard.
Import Dashboards for System Events
To monitor the Orchestra nodes and their system events, import the corresponding dashboard.
-
Repeat step 1 of “Import Dashboards for Process Events” to open the import form.
-
Click “Upload JSON file” and select the dashboard file for system events, typically named
SystemEventsWithoutVariables.model.json. -
Repeat steps 3 and 4 of “Import Dashboards for Process Events” to import the dashboard. The base template, delivered with Orchestra, can be found here
SystemEvents.json.
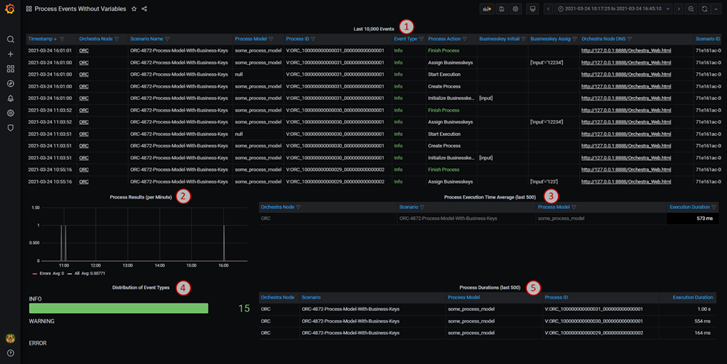
Dashboard Explanation for Process Events (Process Events Without Variables)
-
Displays details for the last 10,000 process events.
- The column “Orchestra Node” links to the Orchestra Monitor for further information.
-
Displays the number of succeeded and failed processes per minute.
-
Displays the average execution duration per Orchestra Node, Scenario, and Process Model.
-
Displays the number of events of types INFO, WARNING, and ERROR.
-
Displays the duration of the last 500 processes.
The filter icon ( ) on table headers allows for filtering specific information.
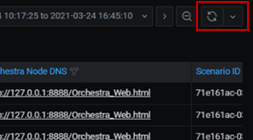
Be aware! Currently, there is a bug that resets all filters upon dashboard refresh. To avoid this, disable frequent refresh.
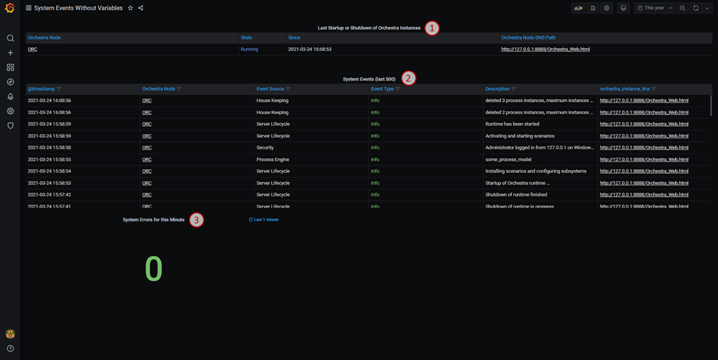
Dashboard Explanation for System Events (System Events Without Variables)
-
Displays the status of all connected Orchestra Nodes.
-
Displays the last 500 system events.
- The column “Orchestra Node” links to the Orchestra Monitor for further information.
-
Displays the number of error events for the current minute.